-
Market Overview

2019 2nd Quarter Overview

2nd Quarter 2019 Market Overview
The Market Giveth, Taketh, and Giveth again
The pace of the market slowed in the second quarter from the torrid gains of Q1. There was a sharp drop in May but a strong recovery in June overcame those losses and kept the major indices in positive territory for the second consecutive quarter.
Despite the strong showing in 2019, the market is only slightly higher than the best levels of 2018.
Consider the path of the market over the last three years. In the 15 months leading to January 2018, the stock market rose every single month. That stretch was the longest uninterrupted advance without a meaningful pullback in history. There was minuscule volatility during this period. Since then, volatility has picked up.
In February of last year, the long advance ended abruptly with a 13% decline in eight days. After this, it took seven choppy months for the S&P 500 to recover and reclaim its high, which it managed to do by last September.
Then, the market threw a tantrum which we all had to endure, last fall. The total decline in the market from October 2 until December 24 was 20%. After that steep drop, the market recovered 6% in the final four trading days of 2018. This is volatility.
The market’s winning ways carried into January with an 8% gain for the month, alone. Then the major indices fell in May between 7% and 10%.
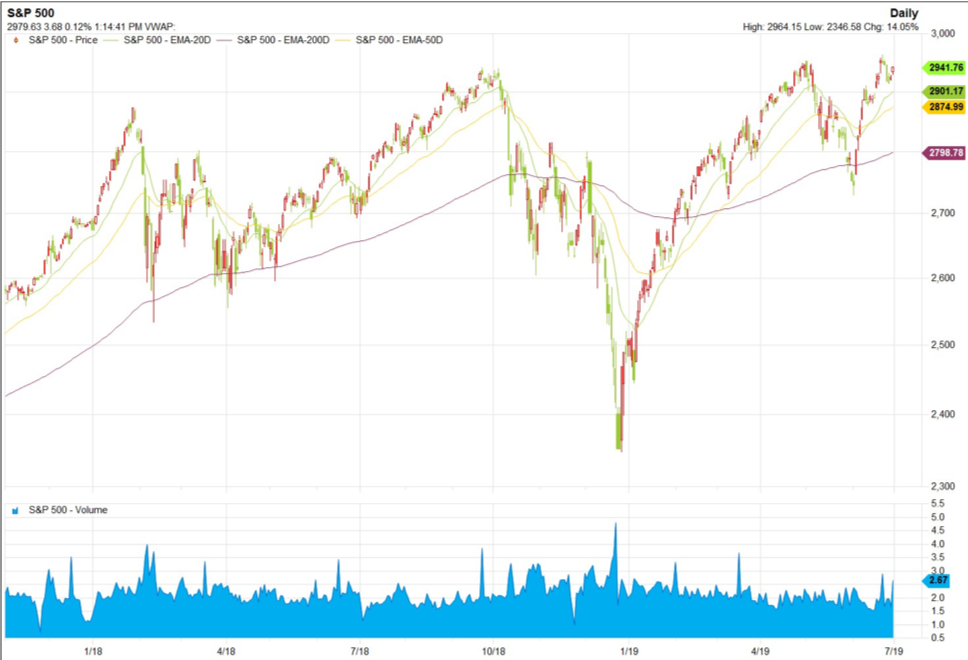
Despite a 17.4% gain for the first half of 2019, it is noteworthy that the S&P is only 2% above its level from January 2018, seventeen months ago. This suggests difficulty investors have in gauging market conditions, given political strife, trade tariffs, and slowing economic growth.
The big question for investors is, can the market consolidate its gains and better yet, build on them, and move significantly above this 17-month trading range?
The graph below illustrates the volatility and the corresponding resistance whenever the market reached its current level.
The Fed is the Main Thing for Stocks
The stock market is paradoxical. Last year, the US economy accelerated while this year, it is decelerating. Last year, interest rates were rising. This year, they are falling. Last year, earnings were showing robust gains. This year, the outlook is for flat earnings. Last year the stock market fell. This year, it is rising. What to make of this?
Simply put, bad news is good news and good news is bad news. This is because of the prominent role of the Federal Reserve on the stock market.
A weaker economy means the Fed will cut rates to ostensibly help the economy. The Fed is signaling that it will lower rates this month and effectively retract the ill-advised hike from last December. Consequently, investors cheer this move.
Fed Chair Jerome Powell said recently, “The bottom line for me is the uncertainties around global growth and trade which continue to weigh on the outlook”. (WSJ) He further stated this is a development that, “strengthened the case for a somewhat more accommodative policy.”
The reality is that if the Fed Funds rate is reduced by 0.25%, it will have a minimal effect on the real economy. The Fed recognizes this. The Fed’s real intention is to inflate asset prices and it does this with easy monetary policy. The Fed is counting on a buoyant stock market to fuel the economy, create more jobs, and raise wages. This means their policy is aimed to propel markets.
Peregrine Strategy
The rapid ascent of the overall market and the apparent stall near the highs has dictated a conservative approach to investment management. We are consistently reminded of volatility. Pullbacks are more likely to occur and they are also more apt to be very sharp, such as what we just experienced in May.
We also take a cautious view of the Fed inflating the stock market since this may not be sustainable without a sharp retracement in the market.
Peregrine client accounts are relying on consistent gains from trading, income payments from our securities, and a conservative investment posture to navigate this environment.
Both our Equity and Balanced Composites are up over 7% for the first six months of 2019. Gains for the S&P 500 seem sure to flatten out for the rest of the year but natural rotation amongst stocks should reveal attractive investment valuation opportunities and pave the way for accounts to add to their gains in the upcoming months.
As a contingency, we continue to hold long term treasury bonds and economically defensive stocks that tend to deliver consistent results in a softer economy. Examples of these companies are Colgate Palmolive, General Mills, Hershey, Kimberly Clark, NextEra Energy, Pepsi, Proctor Gamble, and Waste management.
These investments should remain steady during an increase in volatility in the markets which seems certain to happen at any time.
Dan Botti
Portfolio Manager
7/17/19
Click to Download the Market Overview PDF
Past performance is no guarantee of future results. Investment management involves the possibility of losses. The significant general stock market moves up and down can influence the performance of client portfolios. Composite returns are based on client portfolios of over $100,000. Not all clients are included in the composites. All returns include the reinvestment of dividends. All returns are net of fees. Composite returns are derived from aggregated, time-weighted returns for clients of Peregrine Asset Advisers. Individual client returns can deviate from the composite returns. While Peregrine uses the S&P 500 as a benchmark, Peregrine does not attempt to mimic the structure of this index. Individual client portfolios vary. The number of securities held also varies per client.
Peregrine Asset Advisers ● 9755 SW Barnes Rd. Suite 295 ● Portland Oregon 97225
503.459.4651 ● 800.278.1420 ● www.peregrineaa.com
Overview Archive
- » 2025 2nd Quarter
- » 2025 1st Quarter
- » 2024 4th Quarter
- » 2024 3rd Quarter
- » 2024 2nd Quarter
- » 2024 1st Quarter
- » 2023 4th Quarter
- » 2023 3rd Quarter
- » 2023 2nd Quarter
- » 2023 1st Quarter
- » 2022 4th Quarter
- » 2022 3rd Quarter
- » 2022 2nd Quarter
- » 2022 1st Quarter
- » 2021 4th Quarter
- » 2021 3rd Quarter
- » 2021 2nd Quarter
- » 2021 1st Quarter
- » 2020 4th Quarter
- » 2020 3rd Quarter
- » 2020 2nd Quarter
- » 2020 1st Quarter
- » 2019 4th Quarter
- » 2019 3rd Quarter
- » 2019 2nd Quarter
- » 2019 1st Quarter
- » 2018 4th Quarter
- » 2018 3rd Quarter
- » 2018 2nd Quarter
- » 2018 1st Quarter
- » 2017 4th Quarter
- » 2017 3rd Quarter
- » 2017 2nd Quarter
- » 2017 1st Quarter
- » 2016 4th Quarter
- » 2016 3rd Quarter
- » 2016 2nd Quarter
- » 2016 1st Quarter
- » 2015 4th Quarter
- » 2015 3rd Quarter
- » 2015 2nd Quarter
- » 2015 1st Quarter
- » 2014 4th Quarter
- » 2014 3rd Quarter
- » 2014 2nd Quarter
- » 2014 1st Quarter
- » 2013 4th Quarter
- » 2013 3rd Quarter
- » 2013 2nd Quarter
- » 2013 1st Quarter
- » 2012 4th Quarter
- » 2012 3rd Quarter
- » 2012 2nd Quarter
- » 2012 1st Quarter
- » 2011 4th Quarter
- » 2011 3rd Quarter
- » 2011 2nd Quarter
- » 2011 1st Quarter
- » 2010 4th Quarter
- » 2010 3rd Quarter
- » 2010 2nd Quarter
- » 2010 1st Quarter
- » 2009 4th Quarter
- » 2009 3rd Quarter
- » 2009 2nd Quarter
- » 2009 1st Quarter
- » 2008 4th Quarter
- » 2008 3rd Quarter
- » 2008 2nd Quarter
- » 2008 1st Quarter
- » 2007 4th Quarter
- » 2007 3rd Quarter
- » 2007 2nd Quarter
- » 2007 1st Quarter
- » 2006 4th Quarter
- » 2006 2nd Quarter
- » 2005 Overview